Introduction
Welcome to Build Websites from Scratch!
In this course, you will learn everything you need to make working websites!
You'll start by setting up a development environment so that you can build websites on your own computer.
All the best!
Setup
Getting Started with Atom
Text editors, also called code editors, are applications used by developers to write code. They highlight and format your code so that it’s easier to read and understand. It’s the area you write your code in.
Text editors provide a number of advantages to web developers:
- Language-specific syntax highlighting
- Automatic code indentation
- Color schemes to suit your preferences and optimize code readability
- Plug-ins to catch errors in the code
- A tree view of your project’s folders and files, so you can conveniently navigate your project
- Key shortcuts for faster development
Atom is a fully customizable text editor released by GitHub. Since Atom is written in HTML, CSS, and JavaScript, you can customize it yourself once you’ve learned those languages.
Atom supports Windows 7 or later. Visit this webpage and download atom-windows.zip.
In a few moments, Atom will appear in your Downloads folder as a .zip file.
Follow the instructions in the Windows Installer to get started. You can visit Atom’s Windows install page for more detailed instructions.
In a few moments, Atom will appear in your Downloads folder as a .zip file.
Follow the instructions in the Windows Installer to get started. You can visit Atom’s Windows install page for more detailed instructions.
Atom works on Macs running OS X 10.8 or later. Visit the Atom homepage and click Download For Mac.
In a few moments, Atom will appear in your Downloads folder as a .zip file:
Click on atom-mac.zip to extract the application, then drag the new icon into your Applications folder.
Double-click the application icon to load Atom and get started.
In a few moments, Atom will appear in your Downloads folder as a .zip file:
Click on atom-mac.zip to extract the application, then drag the new icon into your Applications folder.
Double-click the application icon to load Atom and get started.
Development Folders
Before using your text editor, it’s important to establish an organized file system. As the number and size of your projects grow, it becomes increasingly important to know where to save new projects and find old projects.
Most developers store their projects in an easy-to-find directory (what you might be used to calling a folder). Here at CodeHive, we recommend naming this directory [projects]. It will store all of your coding projects.
Whenever you create a new project, no matter how small, you should always make a new folder inside your [projects] directory. You will find that single-file projects can quickly turn into large, multi-folder projects.
Below are the steps you need to follow to create a new folder for all of your programming projects.
You will also learn how to load a new project folder into Atom.
For steps 1 and 2, navigate to a folder using Finder (Mac users) or My Computer (PC users).
1. Navigate to a folder you visit regularly and create a new folder called [projects]. On Mac, this may be your User account. On PC, you may want to save this on your C drive.
2. Inside the [projects] directory, create a new folder called HelloCodeHive. Everything you add to this folder will be part of your HelloCodeHive project.
3. Open Atom on your computer.
4. Atom provides a tree view of your project, so you can conveniently navigate to different folders and files.
In the Atom menu bar, choose [File > Add Project Folder].
This will launch your file manager. Navigate to the HelloCodeHive folder and select Open.
The folder will open in Atom’s side pane. At this point, there should not be any contents in the folder. We’ll add a file in the next exercise.
When you open Atom, the Welcome Guide will appear. For now, we’ll skip getting to know Atom and start writing some code.
Before you learn how to add files to a project folder, it is important to understand the purpose of file extensions.
A file extension is the suffix of a filename and describes the type of content the file contains.
The file extension is always the last 3 or 4 characters in a filename, preceded by a period.
For example, the HTML file extension is .html, and it tells the browser (and other applications) to interpret the contents of the file as a web page.
Once Atom loads a project folder, you can add files. The steps below describe how to add files.
1. In Atom’s top bar, select File > New File. An untitled, blank file will appear.
2. In Atom’s top bar, choose File > Save or Save As. Name the file with its appropriate file extension index.html (.html, .css, .csv).
It is critical that you include the correct file extension, so programs know how to interpret its contents.
3. Begin coding! Save your file often. This will decrease the chances of losing unsaved work.
At this point, your file is ready to be viewed in a web browser. The following steps should be
taken outside of Atom:
1. Back in your file system, navigate to the index.html file in your HelloCodeHive folder.
2. Double click index.html; the page should open in your default web browser.
1. Back in your file system, navigate to the index.html file in your HelloCodeHive folder.
2. Double click index.html; the page should open in your default web browser.
Congratulations! You can create web pages on your own computer!
HTML Introduction
Welcome to the first unit of Build Websites from Scratch!
In this unit, you will learn everything you need to make working websites!
You’ll start by covering the syntax of HTML and learning about the most important HTML tags.
Finally, you’ll build two websites completely from scratch on your computer. Your work may not be pretty at the end of this unit, but it will be completely functional. That’s no small feat!
Good luck!
You will begin your web development journey by learning what HTML is and how to use it to create websites.
HTML is the language used to create the websites you visit every day. All websites, from a simple personal website to a gigantic web application like Facebook, use HTML in some way.
Taking the time to solidify the fundamentals of web development will pay off when you begin creating large, complex sites.
Go To Lesson
HTML is the language used to create the websites you visit every day. All websites, from a simple personal website to a gigantic web application like Facebook, use HTML in some way.
Taking the time to solidify the fundamentals of web development will pay off when you begin creating large, complex sites.
In the last lesson you learned about the minimum amount of HTML code required to
successfully structure a web page, sometimes referred to as “boilerplate code.”
In this lesson you will learn about some of the most commonly used HTML tags. After completing this lesson you will be able to make:
(lists, embed images, and link out to other resources).
Let’s get started!
Go To Lesson
In this lesson you will learn about some of the most commonly used HTML tags. After completing this lesson you will be able to make:
(lists, embed images, and link out to other resources).
Let’s get started!
You learned some of the most popular HTML tags and how they are displayed in a web browser.
These tags lay the groundwork for all websites you create in the future.
You then learned how to develop and view websites on your own computer.
You will build two websites completely from scratch on your computer
1. A Travel Blog.
2. Soup and Salad restaurant.
You've got this!
Go To Projects
You will build two websites completely from scratch on your computer
1. A Travel Blog.
2. Soup and Salad restaurant.
You've got this!
Go To Projects
CSS Introduction
Welcome to the second unit of Build Websites from Scratch!
In this unit, you will learn how to style your websites using CSS! This will allow you to begin making your projects unique and beautiful.
You’ll start by learning how to create CSS files and hook them up to your HTML pages.
You’ll then learn about the syntax of CSS, diving deep into how to select specific elements using CSS selectors and utilizing some of the most important CSS visual rules.
The content on your web page won’t change unless you style it with CSS.
In this lesson you’ll learn how to incorporate CSS in your HTML code and select HTML elements to be styled.
Throughout this lesson, you will understand how to select HTML elements with CSS and apply styles to them.
Go To Lesson
In this lesson you’ll learn how to incorporate CSS in your HTML code and select HTML elements to be styled.
Throughout this lesson, you will understand how to select HTML elements with CSS and apply styles to them.
The purpose of CSS is to modify the appearance of web pages. You’ll understand the structure and
syntax of CSS as you create and modify web pages.
By the end of this lesson you’ll be able to change the appearance of a web page using CSS selectors, properties, and values.
Go To Lesson
By the end of this lesson you’ll be able to change the appearance of a web page using CSS selectors, properties, and values.
Requirements:
- Text editor (we recommend VS Code or Atom)
- An Internet browser
In this article, we’ll cover how to take the CSS skills you’ve learned and use them to create a basic web page built entirely from the tools you have on your computer.
Before you proceed, you should already be familiar with the basics of text editors, local files, and directories. Recap here
We recommend that you watch this explainer video and then follow the instructions below.
If you’d like some optional extra guidance on real-world CSS, watch the second part of the video.
Let’s create a folder structure to support your web page. A well-designed folder structure will help you quickly navigate to the HTML or CSS files that contain your code.
First, open Finder (in Mac) or Explorer (in Windows). Next, create a folder (also known as a directory) called DevProject. This folder will contain all of the files for your HTML and CSS project.
Open the DevProject folder.
Inside, create the following items:
1. A new file called index.html (use your preferred text editor)
2. A new folder called resources
The index.html file will contain the HTML code for your web page, while the resources folder will contain all of the necessary resources needed by the HTML files (CSS files, images, etc.).
Next, open the newly created resources folder.
Inside of this folder, create the following:
1. An additional folder named css
The css folder will contain the CSS files needed to style your web page.
Finally, open the css folder you just created.
Inside of this folder, create the following:
1. A new file named index.css (use your preferred text editor)
The index.css file will contain all of the CSS styling rules that will be applied to your web page.
This overall folder structure will help support your workflow as you add files or resources. At a high-level, here’s what it should look like:

Great! With your folder structure, HTML, and CSS files all in the right place, we can add content to the web page.
First, open the index.html file in your preferred text editor. Next, add the required boilerplate HTML code:
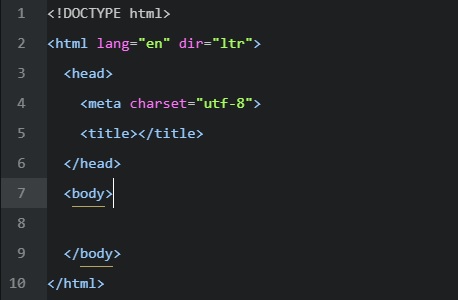
After you add the boilerplate HTML code, feel free to also add the following items:
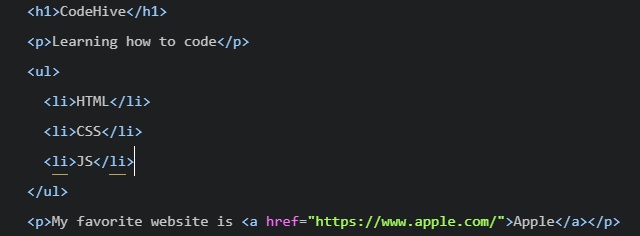
1. Your own title between the (title) tags
2. Your own content within the (body) tags. If you need some quick, pre-written content, feel free to use the following and modify as you wish:
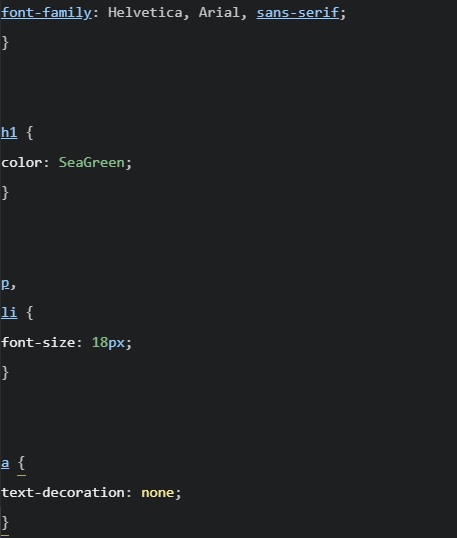
Finally, open the index.css file in your preferred text editor. Add the following pre-written CSS rules to the file (feel free to modify as you wish):
Be sure to save your changes for both files!
As it turns out, the HTML content you added will not be styled by the CSS rules unless index.html and index.css are linked together.
In the (head) section, link the stylesheet to the HTML file.

You might be wondering why the href attribute is set to (./resources/css/index.css.)
This is because you must specify exactly where the index.css file lives within your folder(s) relative to where index.html lives (otherwise, the two files won’t link).
Again, make sure to save your changes!
Let’s take a look at your web page in the browser.
Navigate to your DevProject folder and click on index.html file and to “Open”. The browser should load your web page. What do you see?
At this point, feel free to make changes to your HTML or CSS code. Keep in mind that in order to view any new changes you make, you’ll have to refresh your browser.
In general, the four steps above are a strong starting point for your own developer workflow. As you learn more, you may modify the workflow to fit your specific needs.
At this point, feel free to modify the content of the web page or create an entirely new project.
- Text editor (we recommend VS Code or Atom)
- An Internet browser
Introduction
In this article, we’ll cover how to take the CSS skills you’ve learned and use them to create a basic web page built entirely from the tools you have on your computer.
Before you proceed, you should already be familiar with the basics of text editors, local files, and directories. Recap here
We recommend that you watch this explainer video and then follow the instructions below.
If you’d like some optional extra guidance on real-world CSS, watch the second part of the video.
Step 1: Create a Folder Structure For Your Web Page
Let’s create a folder structure to support your web page. A well-designed folder structure will help you quickly navigate to the HTML or CSS files that contain your code.
First, open Finder (in Mac) or Explorer (in Windows). Next, create a folder (also known as a directory) called DevProject. This folder will contain all of the files for your HTML and CSS project.
Open the DevProject folder.
Inside, create the following items:
1. A new file called index.html (use your preferred text editor)
2. A new folder called resources
The index.html file will contain the HTML code for your web page, while the resources folder will contain all of the necessary resources needed by the HTML files (CSS files, images, etc.).
Next, open the newly created resources folder.
Inside of this folder, create the following:
1. An additional folder named css
The css folder will contain the CSS files needed to style your web page.
Finally, open the css folder you just created.
Inside of this folder, create the following:
1. A new file named index.css (use your preferred text editor)
The index.css file will contain all of the CSS styling rules that will be applied to your web page.
This overall folder structure will help support your workflow as you add files or resources. At a high-level, here’s what it should look like:
Step 2: Add Content To Your Web Page
Great! With your folder structure, HTML, and CSS files all in the right place, we can add content to the web page.
First, open the index.html file in your preferred text editor. Next, add the required boilerplate HTML code:
After you add the boilerplate HTML code, feel free to also add the following items:
1. Your own title between the (title) tags
2. Your own content within the (body) tags. If you need some quick, pre-written content, feel free to use the following and modify as you wish:
Finally, open the index.css file in your preferred text editor. Add the following pre-written CSS rules to the file (feel free to modify as you wish):
Be sure to save your changes for both files!
Step 3: Link Your HTML File and CSS File
As it turns out, the HTML content you added will not be styled by the CSS rules unless index.html and index.css are linked together.
In the (head) section, link the stylesheet to the HTML file.
You might be wondering why the href attribute is set to (./resources/css/index.css.)
This is because you must specify exactly where the index.css file lives within your folder(s) relative to where index.html lives (otherwise, the two files won’t link).
Again, make sure to save your changes!
Step 4: View Your Project
Let’s take a look at your web page in the browser.
Navigate to your DevProject folder and click on index.html file and to “Open”. The browser should load your web page. What do you see?
At this point, feel free to make changes to your HTML or CSS code. Keep in mind that in order to view any new changes you make, you’ll have to refresh your browser.
In general, the four steps above are a strong starting point for your own developer workflow. As you learn more, you may modify the workflow to fit your specific needs.
At this point, feel free to modify the content of the web page or create an entirely new project.
Introduction
Browser developer tools allow web developers to quickly collect important information on most websites. These tools are available within most major web browsers, like Chrome, Safari, and Firefox, to name a few.
Because Google Chrome is the preferred browser for many professional developers, we’ll learn how to use the browser developer tools within Google Chrome, known as Chrome DevTools.
Step 1: Accessing DevTools
The quickest way of accessing DevTools in Chrome is to navigate to any website (like this one) and right click (press [control] and click for a single button mouse) anywhere on the page.
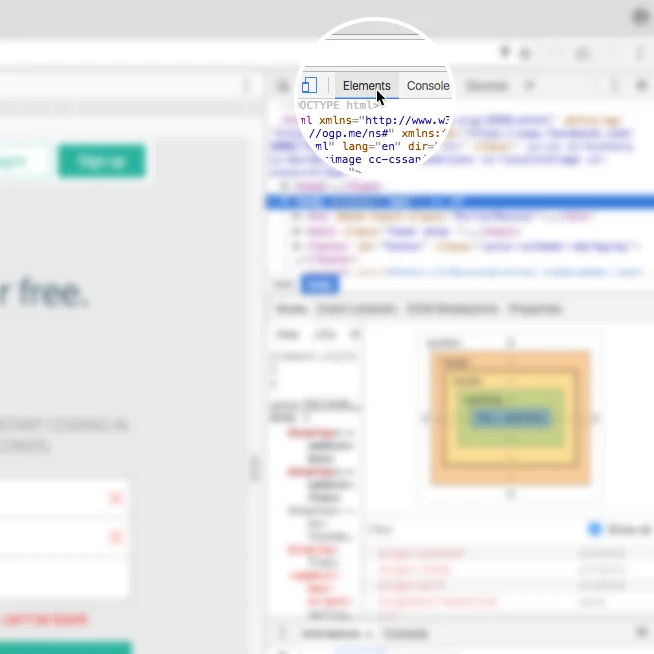
Upon doing so, a menu will appear directly beside the area you clicked on. In the menu, select “Inspect.” This will automatically launch DevTools within your browser. DevTools will appear as a window on either the bottom or right-hand side of your screen. It should look something like this:
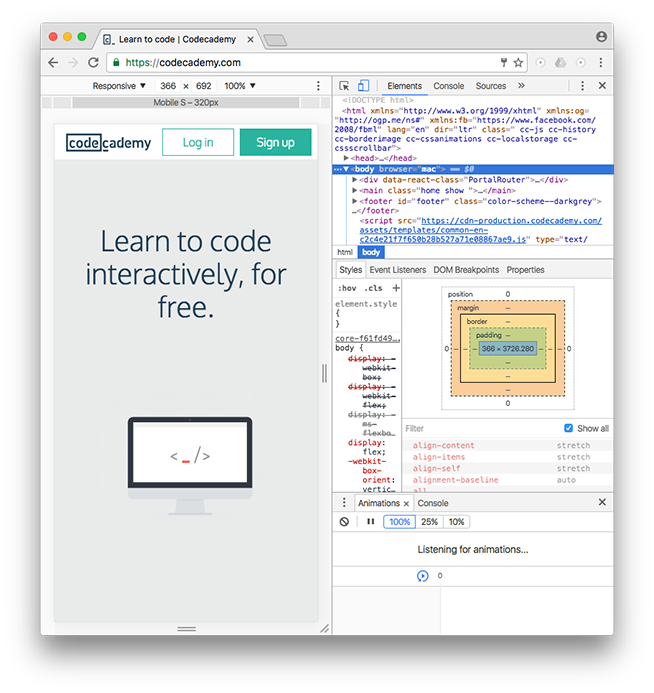
You should see the Elements, Console, Sources, and Network tabs, among many others.
The rest of this article will focus exclusively on the [Elements] tab.
Step 2: Using DevTools to View CSS Styles
DevTools can provide you with a lot of information about a website, but it’s particularly exceptional at examining a page’s HTML elements, along with the CSS styles for those respective elements. Let’s try it out!
1. Open an incognito Chrome browser (in the browser’s menu, click on “File” then “New Incognito Window”). This will allow you to read this article while completing the following steps.
2. Navigate to CodeHive’s homepage (make sure you are logged out).
3. Right click (or [control] and click simultaneously) on any text on the page. (This article uses screenshots from a previous version of the Codecademy home page. Your home page may look different from the one shown in the screenshots.)
4. Select “Inspect” in the menu that appears.
5. DevTools should appear at the bottom of your page (it’s normal if its appears in another location, as its location can be changed).
6. Click on the “Elements” tab of DevTools (if you’re not already on it).
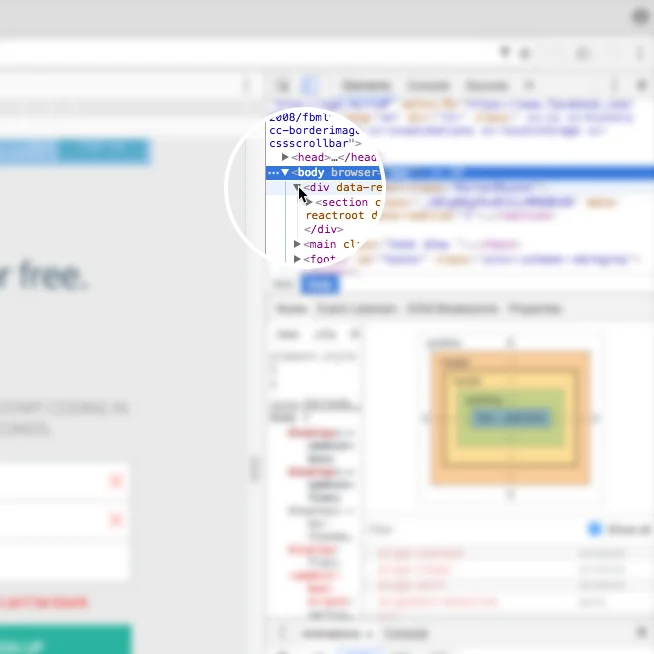
7. In the left pane, notice the interactive DOM (HTML elements) that contains the current content of the web page.
8. Mouse over the HTML code — as you mouse over, notice that DevTools will highlight the corresponding HTML element on the web page.
9. Note that you can expand closed elements by clicking the arrow directly to the left of them.
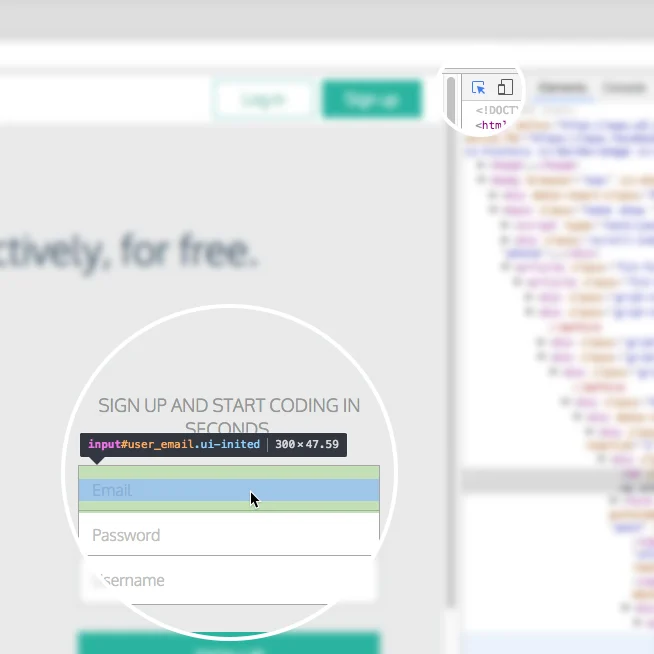
10. Alternatively, click the “Select element” icon (shown in the image below) in the top-left corner of the console and then click on an element within the web page — this is a much quicker way of accessing a specific element on the web page that you want to inspect.
11. On the right hand side of DevTools, click on the tab named [Styles] (if you’re not already on it) — this tab displays all of the CSS styles associated with the element highlighted in the left side of DevTools.
12. Scroll down in the [Styles] tab, notice that some CSS styles are crossed out with a horizontal black line.
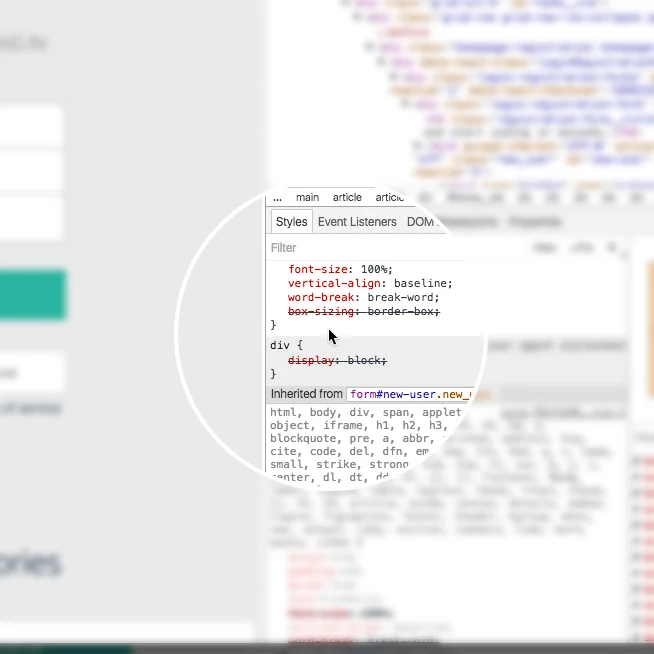
13. Remember, the [Styles] tab shows all styles applied to that element (rules can often be overwritten by more specific rules, which causes the horizontal black line through some CSS rules, denoting that that rule is not being used).
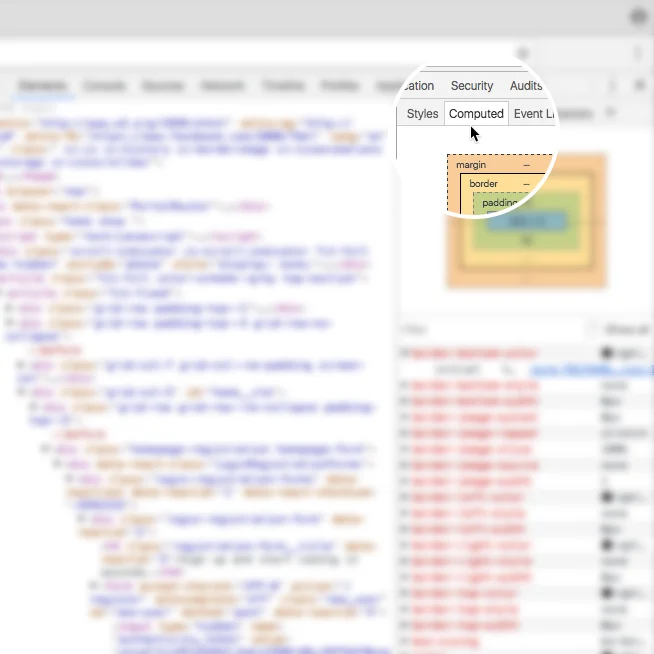
14. To instead view only the styles applied to that specific element, click on the [Computed] tab directly next to the [Styles] tab in the right pane.
In this pane, you will see only the styles that are being applied to that element, also known as the computed styles.
(If the [Computed] tab is not appearing for you, your browser may be sized too small. Expand the width of the browser until it appears.)
Step 3: Modifying CSS Styles with DevTools
DevTools is also useful for modifying existing CSS rules and previewing those changes directly on the page you’re viewing.
To try it out, click again on the [Styles] tab in the right pane of DevTools (feel free to use the CodeHive website again).
Scroll down to a CSS rule (one that is not crossed out with a black line), click on the value of any applied CSS rule, change the value, and press enter on your keyboard. You should see the change automatically update on the page.
There are a few things to keep in mind when using DevTools to modify a web page:
1. When you modify or change a CSS rule, you may be affecting more than one element.
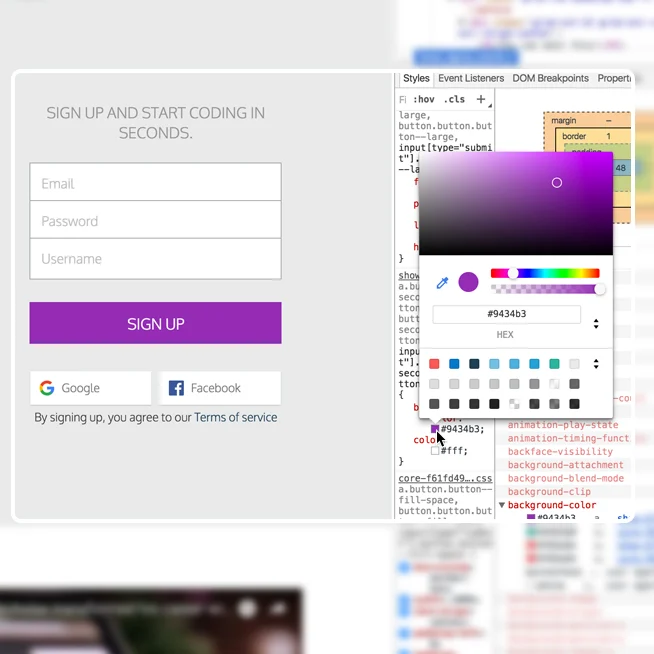
2. DevTools provides easy-to-use tools when you modify certain CSS rules. (For example, when modifying color values, DevTools will provide you with a color picker to help you select a color.)
3. DevTools is only a sandbox tool, meaning that any changes you make to the web page will not be saved, so make sure to write down any changes you’d like to make when using DevTools for your own web page!
Step 4: Add CSS Styles with DevTools
In addition to modifying existing CSS rules, you can add new CSS rules as well. Let’s continue using DevTools on the CodeHive homepage.
1. Locate some text on the home page (i.e. find a heading, paragraph, link, etc.).
2. Right click on the text and click “Inspect” in the menu that appears. DevTools will highlight the corresponding HTML element in its left pane.
3. Take a look at the [Styles] tab and click on the + icon in the top-right corner of the right pane; notice that this creates a new, empty CSS rule for that element.
4. Within the element’s selector, click and add a new CSS declaration. The following is an example (feel free to add your own declaration):

You should see the background color of the text you selected change to red. You can also continue to add your own CSS styling as you wish.
In the future, try this technique on your own website(s) as you build them from the ground up. Building with DevTools can result in a more efficient workflow, as it can help you avoid repeatedly saving and viewing changes manually.
Step 5: Modify HTML with DevTools
DevTools also lets you directly modify the HTML content of a web page. Let’s try this out one more time on the CodeHive homepage.
1. Again, right click on a piece of text on the homepage and click “Inspect” in the menu that appears.
2. DevTools will automatically highlight the HTML code in the left pane associated with the content that you inspected on the web page.
3. In DevTools, double click on the text between the opening and closing tags of the text you right-clicked on.
4. Change the heading to say something else, like your name, or “CodeHive”, and press enter.
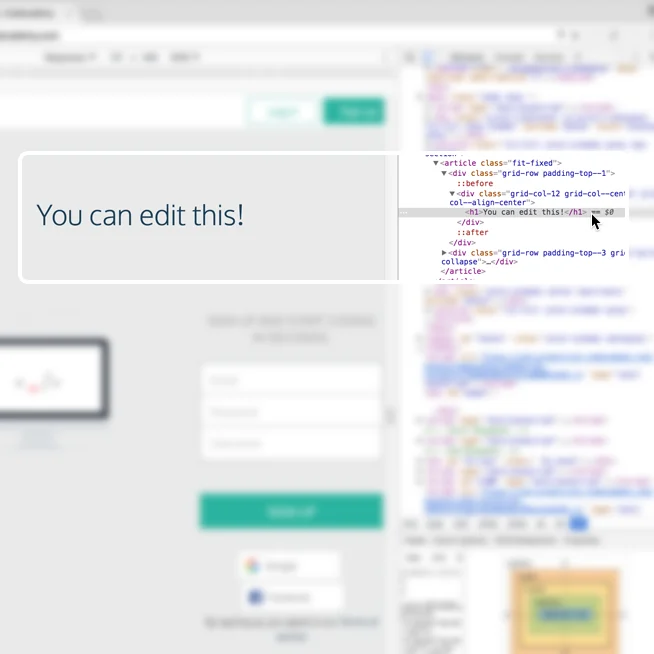
At this point, you should see the text change!
You can also add HTML of your own as well. Let’s add an h2 element directly below the element you just modified.
1. Right click on the element you just modified, a menu should appear. Click on “Edit as HTML.” (You can also delete elements using this menu.)
2. A large text field should appear. Directly edit the HTML by adding an h2 element below with the text of your choice.
3. To complete/view your changes, click on any other element in the left window pane or press command and enter at the same time (on a Mac keyboard).
What happens to the web page? Remember, these are sandboxed changes, so your changes will not be saved, nor permanently affect the website you are applying changes to.
Review
The Chrome web browser provides you with robust web developer tools known as DevTools. With DevTools, you can view a web page’s existing DOM elements and associated styles, as well as modify and preview changes you make to the web page, resulting in an efficient workflow. If you’re interested in learning more about DevTools, visit the official documentation at https://developer.chrome.com/devtools.
Happy coding!
